Description
Low Frequency Detector
![]()
"Low Frequency Detector" is a new acoustic measurement tool for detecting the low frequency sound that is hard to hear in normal situation. It supports very lower frequency range less than 100Hz by our proprietary sound sensing technology.
The human ear is not sensitive enough to low-frequency sounds. If you are exposed to the noise of nearby construction and factories without noticing, you may have a bad feeling and a sense of oppression. In such cases, you can use this app to check what kind of low-frequency noise is present.
In general, the low frequency sound is a sound wave from 1Hz to 100Hz. Depending on its frequency component and sound level, the degree of influence on the human body and the noise sensation is different.
This app allows you to examine the frequency component of low-frequency sound by 1/3 octave band analysis and FFT analysis.
Please to click the link below to visit the product page on AppStoreTM.
![]()
- Communications charges when connecting to AppStore will be borne by the customer.
- iPhone is a trademark of Apple Inc., registered in the U.S. and other countries. AppStore is a service mark of Apple Inc.
Products Information
- Version: 7.0.1
- Release date: December 20, 2025. UTC
- Size: 0.7 MB
- Category: Utilities, Life Style
- Compatibility: Compatible with iPhone. Requires iOS 18.7 or later. iPad are not recommended.
- Status: Now distributing.
Features
- Optimized for iPhone, Compact code size.
- Low frequency power level measurement from 5Hz to 100Hz (LF): Flat characteristic, Updating indication of measurement period 1sec.
- Power level measurement in the audible band (Leq): Flat characteristic, Updating indication of measurement period 200ms.
- 1/3 octave band analysis (Oct)
- FFT analysis (FFT)
- Time course graph (TIME)
- Snapshot (Snap) on the measurement display screen.
- Report function (Report): Analysis report of a peak LF Level with TIME, OCT and FFT.
- Measurement time : up to 60 sec.
Low Frequency Sounds
In general, low-frequency sounds are sound waves with frequencies below 100 Hz, and their effect on the human body and noise perception depend on their frequency components and sound level. The lower the frequency, the less sensitive the auditory sense becomes, and at very low frequencies below 20 Hz, the sound becomes almost unrecognizable. Despite the various physical and psychological effects of low-frequency sound, it is not objectively recognizable, and this has led to a variety of social problems.
Sources of low-frequency sound include the followings:
- Domestic sources: Heat Pump water heaters, household fuel cells, ventilation fans, refrigerators, air conditioners, blowers, Vibration of water supply pipes, drainage pumps, etc.
- Outdoor sources: automobiles, trains, aircraft, outdoor units of building air conditioners, factory noise, long-term vibration of road bridges, wind power generation, flood control facilities, substation facilities, etc.
If you are feeling unexplained or unwell, you may be exposed to such low-frequency noises.
This app is a sound measurement tool for detecting the low-frequency sound, and it can measure the low-frequency power level and perform frequency domain analysis (1/3 octave band analysis and FFT analysis). The sound level measurement of low-frequency sounds is the level difference with respect to the reference signal (1kHz sine wave), and the relative power level value is displayed.
Important initial settings
In order for this app to work properly, it is necessary to make the following initial settings related to the iOS system.
- Microphone access permission setting
At the initial startup after installing the app, the iOS system asks for permission to access the built-in microphone. In this case, you need to enable access to "Microphone".
If you have not enabled this setting, this app can not work by privacy restrictions of the iOS system. Please enable the access permission on the iOS setting, "Settings > Privacy & Security > Microphone".
- Photos access permission setting
When the first time you save an image data with Snapshot, the iOS system asks for permission to access the "Photos" library. In this case, you need to enable access to "Photos".
If you have not enabled this setting, this app can not work by privacy restrictions of the iOS system. Please enable the access permission on the iOS setting, "Settings > Privacy & Security > Photos".
Operation procedure
Measurement analysis of low-frequency sound is performed in the following step. Be sure to set the measurement conditions in Step-1 once before starting the measurement analysis.
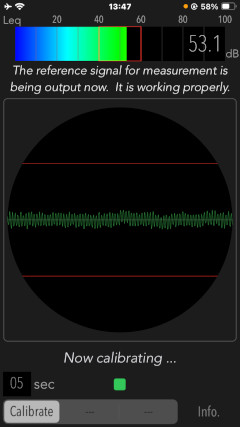
Step-1) Calibration (Calibrate)
A reference signal (1kHz sine wave) is output to determine the reference noise level for the low-frequency component. If the volume level of iPhone is set to about 20-50%, the calibration will automatically adjust it to the optimum volume level for the reference signal.
* Please adjust in a quiet environment as much as possible.
* When the iPhone volume level is set to about 20-50%, calibration automatically adjusts the volume level to the optimum level for the reference signal.
* Do not change the volume setting of the iPhone after calibration or during measurement.
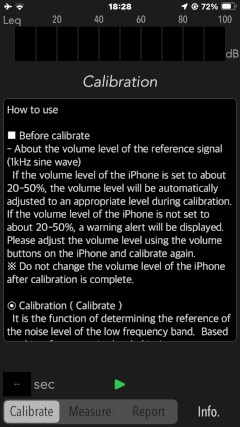
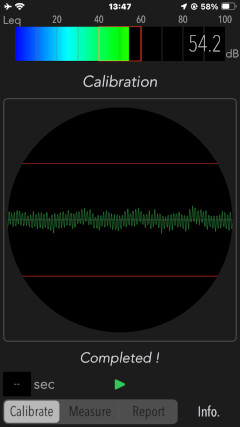
The accuracy of the reference value is displayed as a result after the calibration is finished. If you measure with "Terminated.(low accuracy)", the measurement accuracy may be degraded.
- Completed ! : Normal state.
- Terminated.(low accuracy) : Low accuracy state. When used on this state, the measurement accuracy may be reduced.
Step-2) Measurement (Measure)
Detects low-frequency sound levels from 5 to 100 Hz.
It is done by capturing the ambient sound from the microphone while playing back a reference signal and analyzing it. Take this measurement where you think the low-frequency noise is present. It stops automatically after a maximum of 60 seconds.
* In the case high power of 1kHz component is included in the measured noise source, the precision of measured value by this app largely decreases.
Step-3) Measurement display
The measurement indication can select either 1/3 octave band frequency analysis, FFT analysis, or low-frequency sound level time transition chart. These measurement analysis displays are updated in real time. In addition, after the completion of the measurement, you can show the analysis report.

Sound Level
The sound level shows the power level (Leq) of the audible band and the low-frequency power level (LF Level) less than 100 Hz. At this time, these update period are "Leq" with 0.2 seconds and "LF Level" with 1 second.
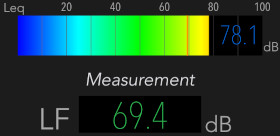
- LF (dB) :
It is a low-frequency power level 0f 100 Hz or less. It is the unique specified value calculated base on the level of reference signal 1kHz. * This is only a reference value as it depends on the reference signal level from calibration.
- Leq (dB) :
It is the equivalent sound level with the frequency weight characteristic Z (Flat) of the audible band. "Leq" contains the sound of the reference sine wave 1kHz. Therefore, it is different from the measurement value with a general sound level meter.
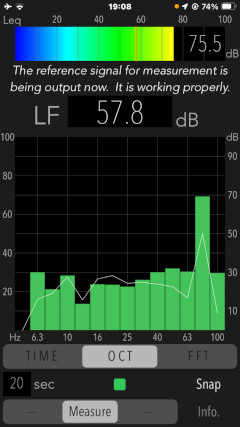
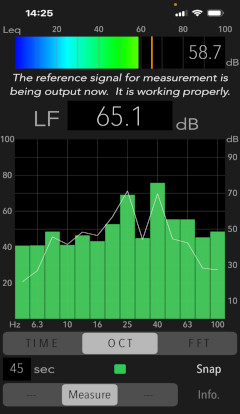
1/3 Octave Band Analysis (OCT)
In this analysis, the power spectrum in the low-frequency sound is displayed by the frequency component band that is divided into fourteen from the center frequency 5Hz to 100Hz. This display is updated in real time, and you can intuitively grasp the frequency component of low-frequency sound. In addition, the white line display shows the frequency characteristic with the frequency weight corrected for the G characteristic.
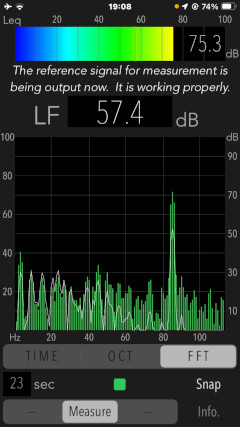
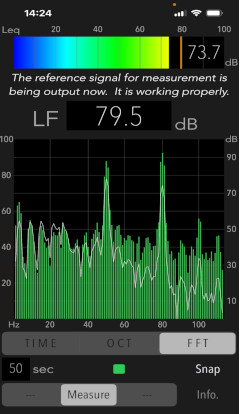
FFT Analysis (FFT)
In this analysis, FFT (Fast Fourier Transform) is performed on the low-frequency sound, and the power for each frequency component is displayed in spectrum so that the instantaneous frequency peak can be observed. This display is updated in real time, and you can intuitively grasp the frequency component of low-frequency sound. In addition, the white line display shows the frequency characteristic with the frequency weight corrected for the G characteristic.
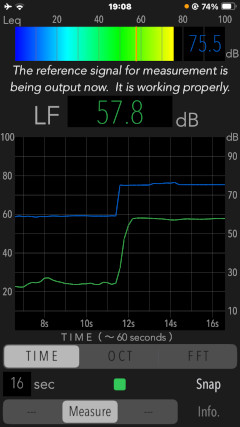
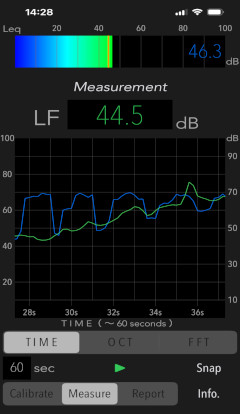
Time course graph (TIME)
In this analysis, the time transition of the observed low-frequency sound power level (LF Level) is displayed as a graph chart. The vertical axis shows the power level and the horizontal axis updates and displays in real time.
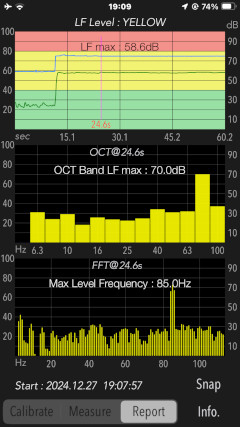
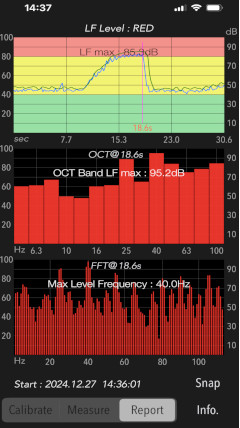
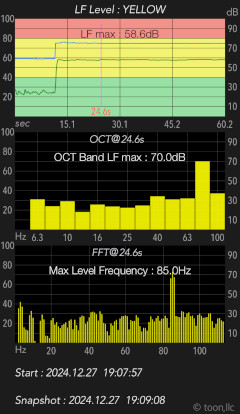
Report
After the completion of the measurement, you can display the report of peak LF Level analysis. It is valid when measured for more than 10 seconds.
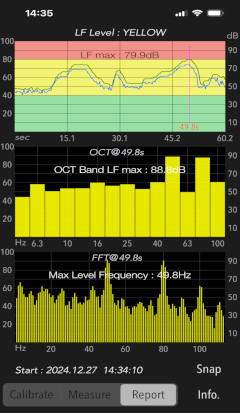
- Time course graph : TIME
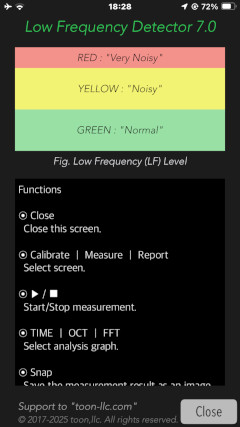
# low-frequency (LF) Level (dB) : Time course graph. It also shows the noise level judgment at the peak level.
- RED (more than 80 dB) : Very loud
- YELLOW (40 to 80 dB) : Loud (* It may contain prominent specific frequency components. It is possible that specific protrusive low-frequency components are included.)
- GREEN (less than 40 dB) : Moderated
# LF max (dB) : maximum dB value of low-frequency.
It is the maximum dB value of the low-frequency power below 100Hz during measurement. (The observed time is indicated by red line on the graph.)
* In the case of 80dB or more, it is judged unconditionally as low-frequency noise. Between 40 and 80dB, it is judged as low-frequency noise only if there is protrusive noise in a specific band. Rarely, the result report has a value larger than "LF max". Sudden noise or impulsive sounds are not considered low-frequency noise.
- Frequency response graph : OCT
# OCT Band LF max (dB): It is the maximum dB value within 1/3 octave band when "LF max" observation.
- Frequency response graph : FFT
# Max Level Frequency (Hz): It is the peak frequency when "LF max" observation.
Snapshot
Tap "Snap" button to save the current measurement display to "Photos". Time information is also imported into the image.
Information view
Tap "Info" button to display the product information and function description. The function description can be scrolled vertically.
Release Note
- Version 7.0.1 was released on December 20, 2025. UTC
- Version 7.0 was released on December 31, 2024. UTC
- Version 6.0 was released on September 28, 2023. UTC
- Version 5.0 was released on November 20, 2022. UTC
- Version 4.0 was released on December 1, 2021. UTC
- Version 3.1 was released on February 2, 2021. UTC
- Version 3.0 was released on June 19, 2020. UTC
- Version 2.0 was released on December 12, 2018. UTC
- Version 1.4 was released on May 18, 2018. UTC
- Version 1.3 was released on April 17, 2018. UTC
- Version 1.2 was released on February 25, 2018. UTC
- Version 1.1 was released on May 9, 2017. UTC
- Version 1.0 was released on January 26, 2017. UTC
Note
- The sound measurement of the low-frequency range is a level difference with respect to the reference signal (1kHz sine wave), which indicates the relative power level.
- The reference signal is output during calibration and sound level measurement.
- Do not change the volume level of iPhone after the calibration.
- White line in the OCT and FFT modes indicates frequency characteristics in frequency weight correction of G characteristics.
- Since iPhone's built-in microphone has a lower sensitivity on the very low-frequency range, it is not recommended to measure a huge volume sound near a very loud noise source.
- Since it takes a while for the observation value to stabilize immediately after the start of measurement, the maximum value is calculated from about 2 seconds later.
- In the case high power of 1kHz component is included in the measured noise source, the precision of measured value by this app largely decreases.
- Sudden noise or impulsive sounds are not low-frequency noises in general.
- The previous calibration information can be maintained internally.
- The analysis results may vary due to individual differences in iPhone devices.
- The authorization for access to the built-in microphone and Photos will be confirmed by the iOS system at first access. Please enable access to Microphone and Photos.
Request for review
Please send a review of your comments and requests for this app. We will use your review to improve our products. Thank you for your cooperation.
- Please fill in your review by accessing from iOS device.
Contact us
For inquiries and consultation regarding our iOS app products, please contact the following support desk.
About Inquiries