Description - iOS app / Noise Viewer
Noise Viewer - frequency fluctuation detector
![]()
“Noise Viewer” is a new sound analysis app that can visualize the frequency fluctuation in the noise sound. It can detect the frequency variation noise that can not be measured by the traditional sound analysis.
You may feel a beating noise sound in the familiar sounds daily? For examples, car engine sound, air conditioning, refrigerator, motor rotation sound, ventilation fan, winds, cry of bugs, so it might be a harsh noise for you. This app will help you discover the noise detection and its causes.
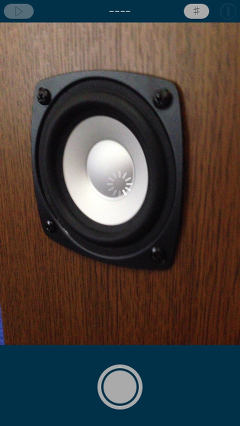
“Noise Viewer” will start the camera capturing and the sound recordings simultaneously on Recording mode after the app launching. If you find the sound source of your interest, please press "Shot" button to visualize the sound source of the previous 15 seconds. Then, it will be displayed on the fluctuation analysis results with the captured image.
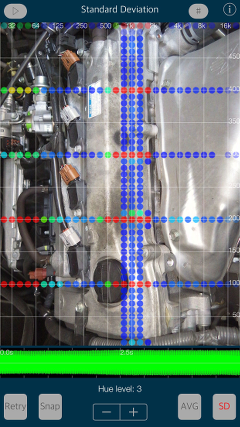
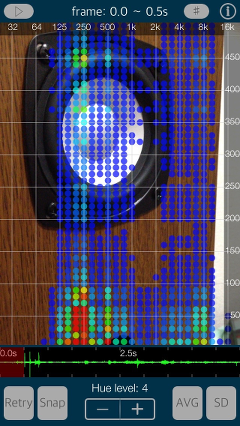
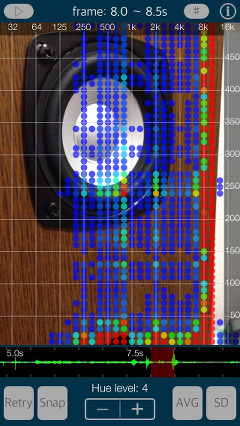
The analysis results will be displayed the intensity of the energy classified by color, as the fluctuation frequency component on the vertical axis and the frequency spectrum analysis on the horizontal axis. The signal strength of each frequency will be drawn full color graphics. It is more stronger as the color graphic becomes close to red.
In addition, you can continuously play back the visualization results of the sound source on the Playback mode.
For your comfortable life, try to find an unpleasant sound like a beat sound. It will help to resolve your sound problem.
Products Information
- Version : 1.1
- Release date : September 28, 2016. UTC
- Size : 0.5 MB
- Category : Utilities, Life style
- Recommendation : Requires iOS 9.3 or later.
- Status : Unsubscribe
Features
- Optimized for iPhone, Compact code size.
- Fluctuation frequency noise visualization with the captured image.
- Display of sound analysis:
- Frequency spectrum analysis on the horizontal axis : 20 - 20000 Hz by the log-scale.
- Fluctuation frequency component on the vertical axis : 5 - 500 Hz by linear scale.
- Intensity of the energy classified by color : Stronger as the color becomes close to red.- Time scaler of recorded waveform : 0 - 15.0 sec. (unit per 0.5 sec.)
- Recording time : 15 seconds (maximum) as just before tapping “Stop”.
- Analysis frame time : 0.5 sec.
- Frame numbers : 30 frame.
- Hue control for the color graphics. : 0 - 10 level.
- Grid scale display (#)
- Capture the measurement results to Photos. (SNAP)
- Retry to record sounds and analysis. (Retry)
- Average value (AVG)
- Standard Deviation (SD)
- Playback function : Display of the noise analysis with recording sound.
- Display of sound analysis:
Mode
"Noise Viewer" has three modes of operation, the function of each mode is as follows:
- Recording mode : Sound recording & capturing at the bootup or Retry.
- Analysis mode : Sound Analysis and display the analysis visualization result on each frame.
- Playback mode : Playback the analysis visualization result continuously.
Operating procedure
# Recording mode
- 1) Launch this app or Tap "Retry", it starts collecting the sound on Recording mode.
- 2) Tap “Shot” to process the sound analysis for the previous 15 seconds.
- 1) Display of the noise analysis result on Analysis mode.
- 2) Select a sound frame on the "Time Slider" (waveform display).
- 3) Setting the noise analysis controls by “Hue level”, “#”, “AVG” and “SD”.
- 4) Tap “Retry” to analyze the new sound sources again.
- 1) Tap the top left button on Analysis mode, it selects Playback mode.
- 2) Tap the Play button, the playback is done.
- "Hue Level” : You can adjust the display color level of noise analysis results.
- "#" : This will enable/disable the grid display.
- "Time Slider" : By tapping/scrolling the "Time slider"(waveform display), you can select the frame.
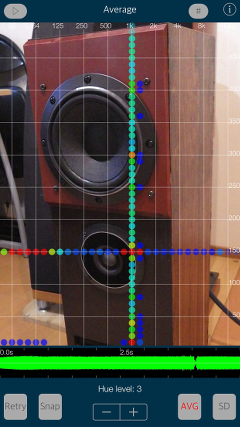
- "AVG" : It displays the average value of the total measurement time.
- "SD" : It displays the standard deviation of the total measurement time.
- "Snap" : It captures the measured image to Photos. It will be saved in JPEG format. At the first time, the confirmation of access to the Photos is required once from iOS system when you press Snap button.
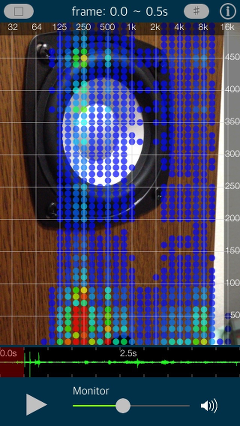
- "Play" : Transition to the playback mode by tapping the top left button, it can be continuously reproduced and displayed the noise analysis results.
- "Retry" : Transition to Recording mode, again, and collected the sound data.
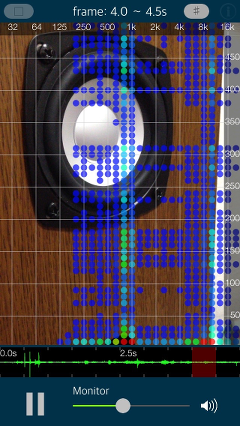
- "PLAY/PAUSE" : By tapping the bottom playback button, it displays the noise analysis results with sound playback. If you tap again, it will pause. It stop playing by the maximum15 seconds automatically.
- "Volume Slider" : You can adjust the playback volume with the "Volume Slider". Since the playback volume is set to low, please adjust in conjunction with the hardware volume.
- "#" : This will enable/disable the grid display.
- Noise Viewer version 1.1 was released on September 28, 2016. UTC
- Noise Viewer version 1.0 was released on September 13, 2016. UTC
# Analysis mode
# Playback mode
Recording mode
This mode is to capture the sound from the built-in microphone as continuously recording data.
It will be run at app initial startup or "Retry".
By tapping the "Shot" button, the sound recording stops and the camera shooting is done at the same time. It will transition to the analysis mode. The recording data of the previous max 15 seconds will be retained.
Analysis mode
This mode displays the sound analysis results with the camera still image.
he analysis results will be displayed the intensity of the energy classified by color, as the fluctuation frequency component on the vertical axis and the frequency spectrum analysis on the horizontal axis. The signal strength of each frequency will be drawn full color graphics. It is more stronger as the color graphic becomes close to red.
The sound data will be analyzed in 1 frame unit (0.5 seconds). By scrolling/tapping the "Time slider", you can display the noise analysis results on a frame-by-frame basis.
Each function in this mode is as follows:
Playback Mode
Playback mode can be continuously reproduced and displayed the noise analysis results. Transitions to the playback mode by tapping the top left button in the analysis mode. It will return to the analysis mode by tapping the top left button again.
Information:Info
By tapping "i." button, it is displayed the product information. If you tap the "Support Information", Safari starts and you can see our support page. If you tap the "Other Apps Information", you will see our App's information on the "App Store".
Release Note
Precautions
At the time of the first access to Camara/Microphone/Photos after installing the app, you will be asked authorization to access them by the iOS system. If you have not enabled this setting, the app can not access them by privacy restrictions of the iOS system. Please enable the access permission on the iOS setting, "Settings > Privacy > Camera or Microphone or Photos".
Please make this setting certainly, since there is a case that application operation becomes unstable in relation to the iOS version withother system settings if you do not do this setting.
Note
During the sound recording operation, the recorded data is not be retained if you have an incoming call (including FaceTime). Once tap the "shot" button, please try again the sound recording by tapping "Retry".
Playback sound has been smaller set, so please adjust to well audible volume.
This app is compatible with iOS9.3. In the latest iOS10, there is a case where the Snap image may not be saved correctly, by the iOS system settings (e.g. Mute setting). Currently, we are considering support for the iOS10.
Support index